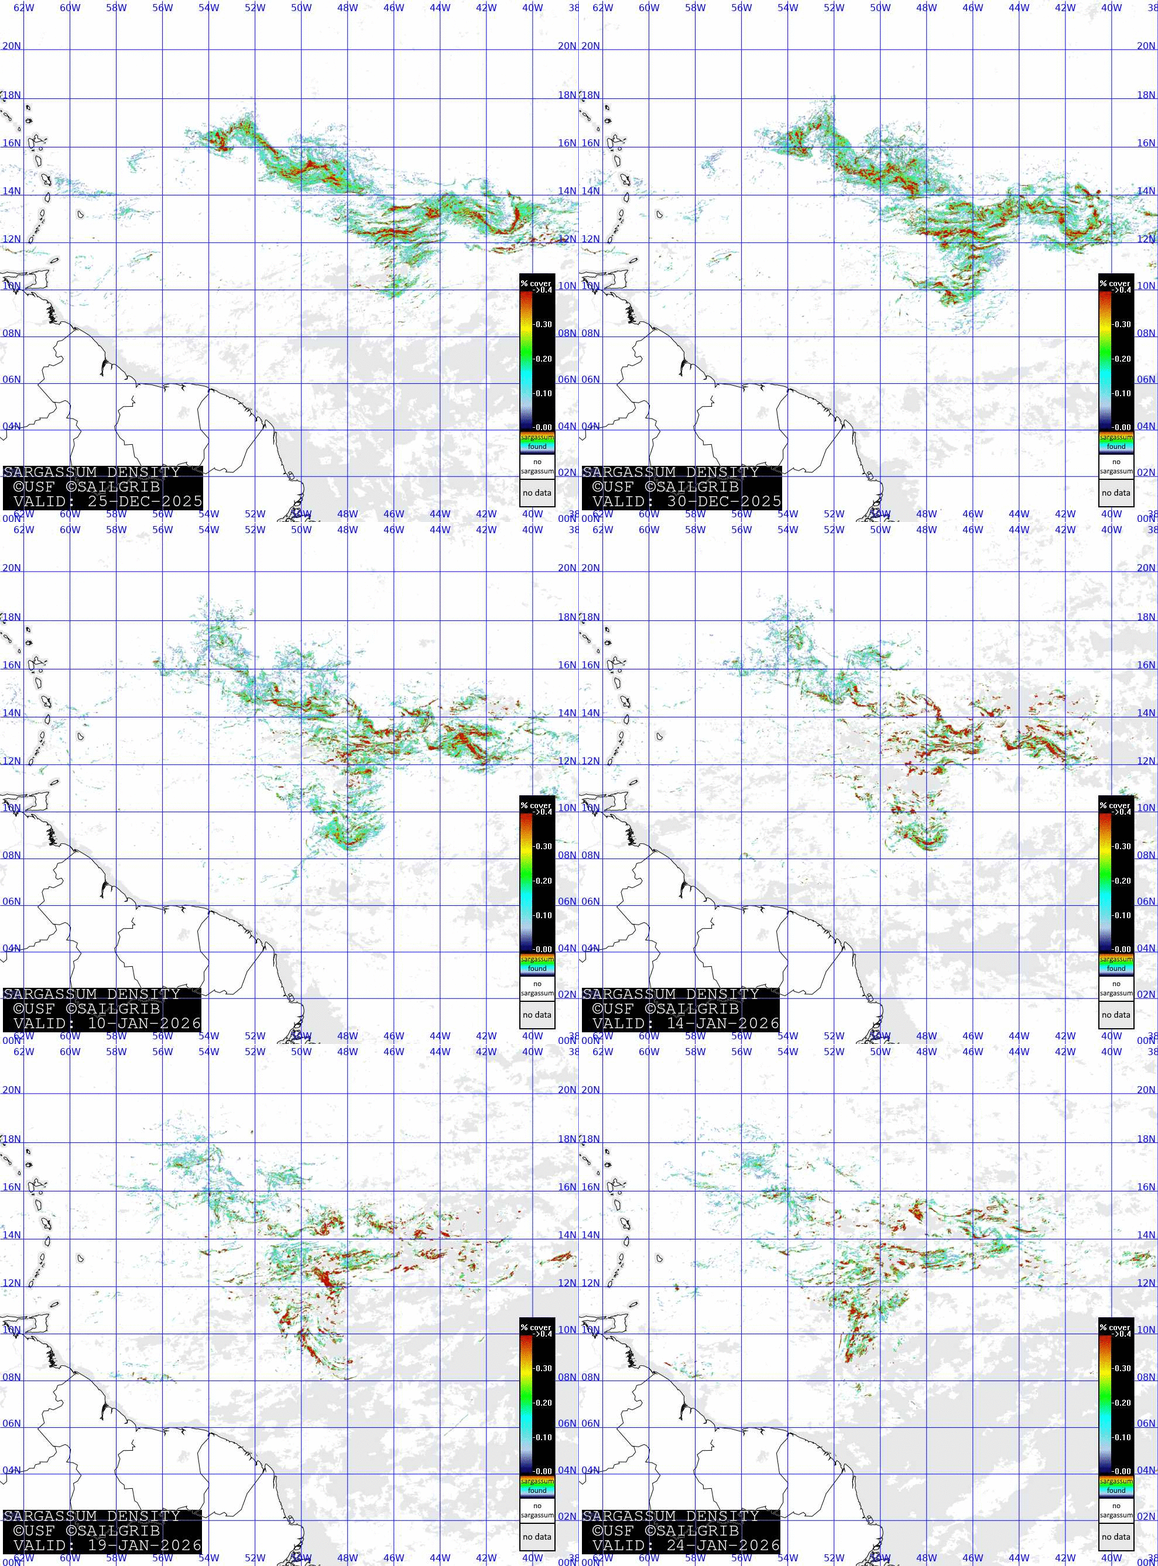
Atlantic evolution of the Sargassum belt

Map provided by Sailgrib.com
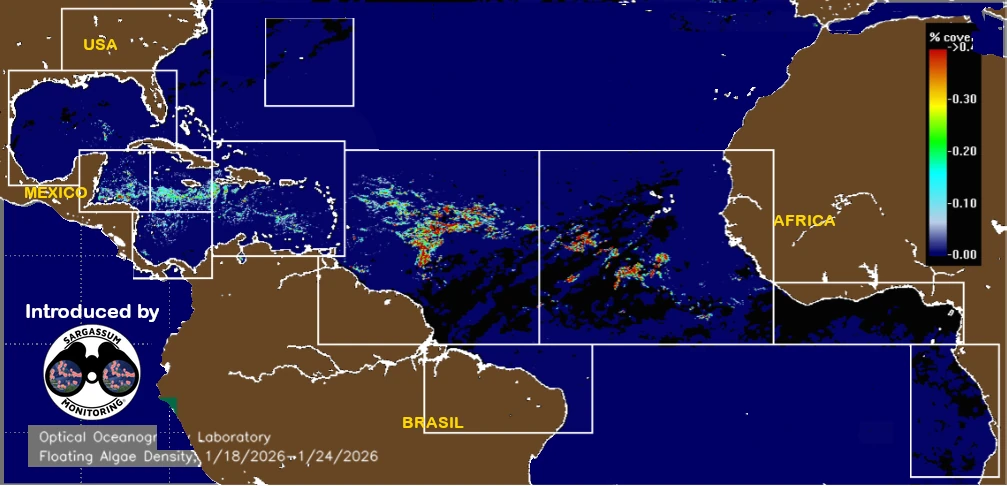
Latest Map from USF – SaWS
Legend of the USF-SaWS Map :
Images are an interpretation of satellite images.

Updated on January 26, 2026
Sargassum map – Caribbean Sea
How are Sargassum stranding forecasts calculated ?
Sargassum movement forecasting method :
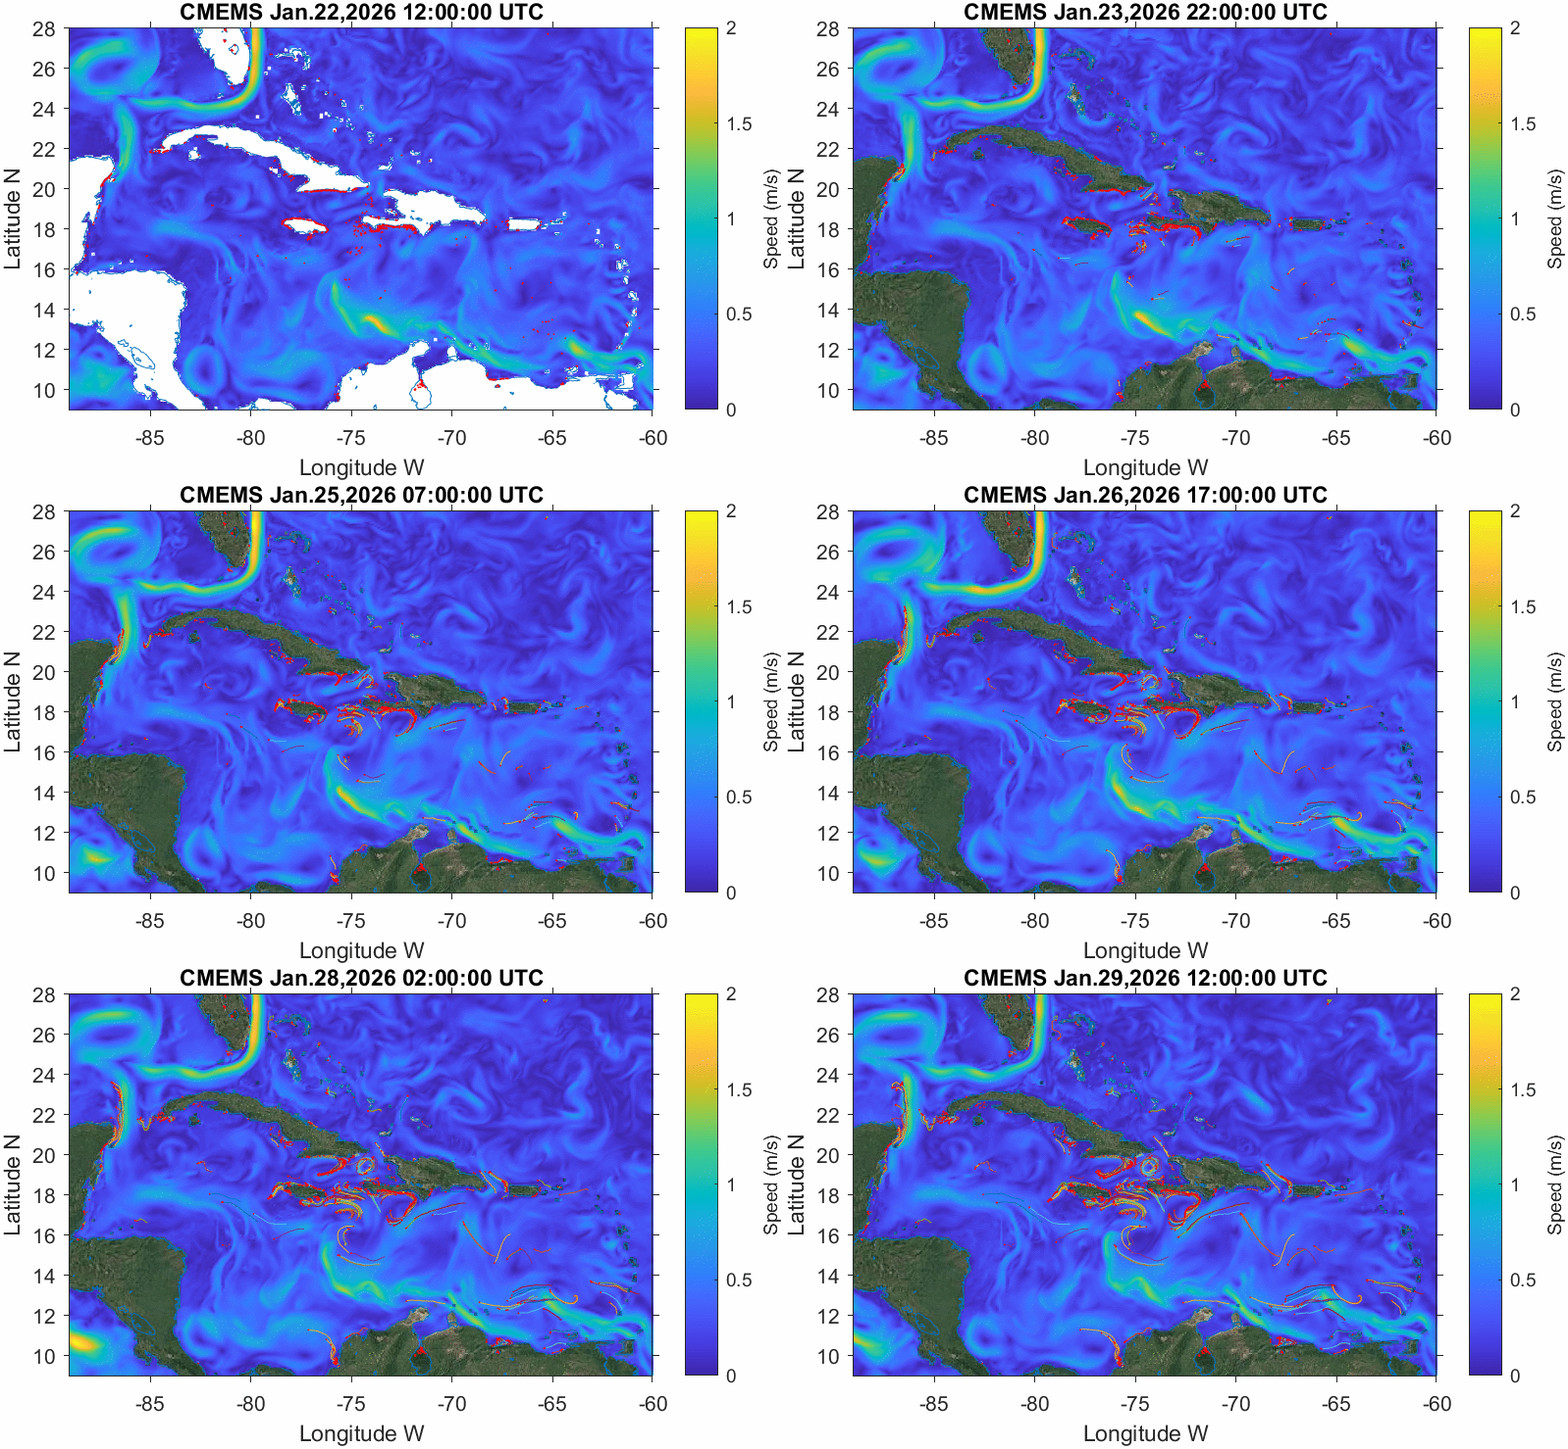
Each red dot corresponds to a sargassum patch identified by the “AFAI” thanks to satellites. The sargassum layer is influenced by environmental conditions in the area, such as currents and winds. Based on current forecasts from “HYCOM” and wind forecasts from “NCEP”, it is possible to estimate the trajectory of the sargassum and its possible arrival along Caribbean beaches.
The image in this animation corresponds to 7 days, as you can see from the dates at the top of the image.
These forecasts give a general indication, but their reliability is limited to current knowledge of sargassum.

Updated on January 26, 2026
This information is provided by the Mexican government.
Sargassum trajectories – Diffusion + currents (HYCOM) + windage (NCEP)

